This article is Post #3 in my series, Dumb Shit I’ve Done in a Production Environment. When I wrote up Post #2, I didn’t know it would be a series. And until I thought “hey, this might make a series” and looked through my Archives, I’d totally forgotten about Post #1.
The series will conclude once I stop doing dumb shit in a Production enviroment.
The Setup
My employer – redacted here, as always – had grown tired of maintaining our in-house RabbitMQ message broker. We’d stopped upgrading at v2.8.7, so we had no DLX capabilities and no simple Web UI for manually re-submitting messages to a queue.
AWS SQS offered both of these features and allowed us to do away with the self-maintenance.
Seeing as we were already invested in Amazon’s Cloud services, we decided to make the switch. It also aligned nicely with our deployment strategy; Elastic Beanstalk provided a simple way to spin up a containerized Worker daemon to consume SQS messages, without all the messy overhead of setting up SNS routes & subscriptions.
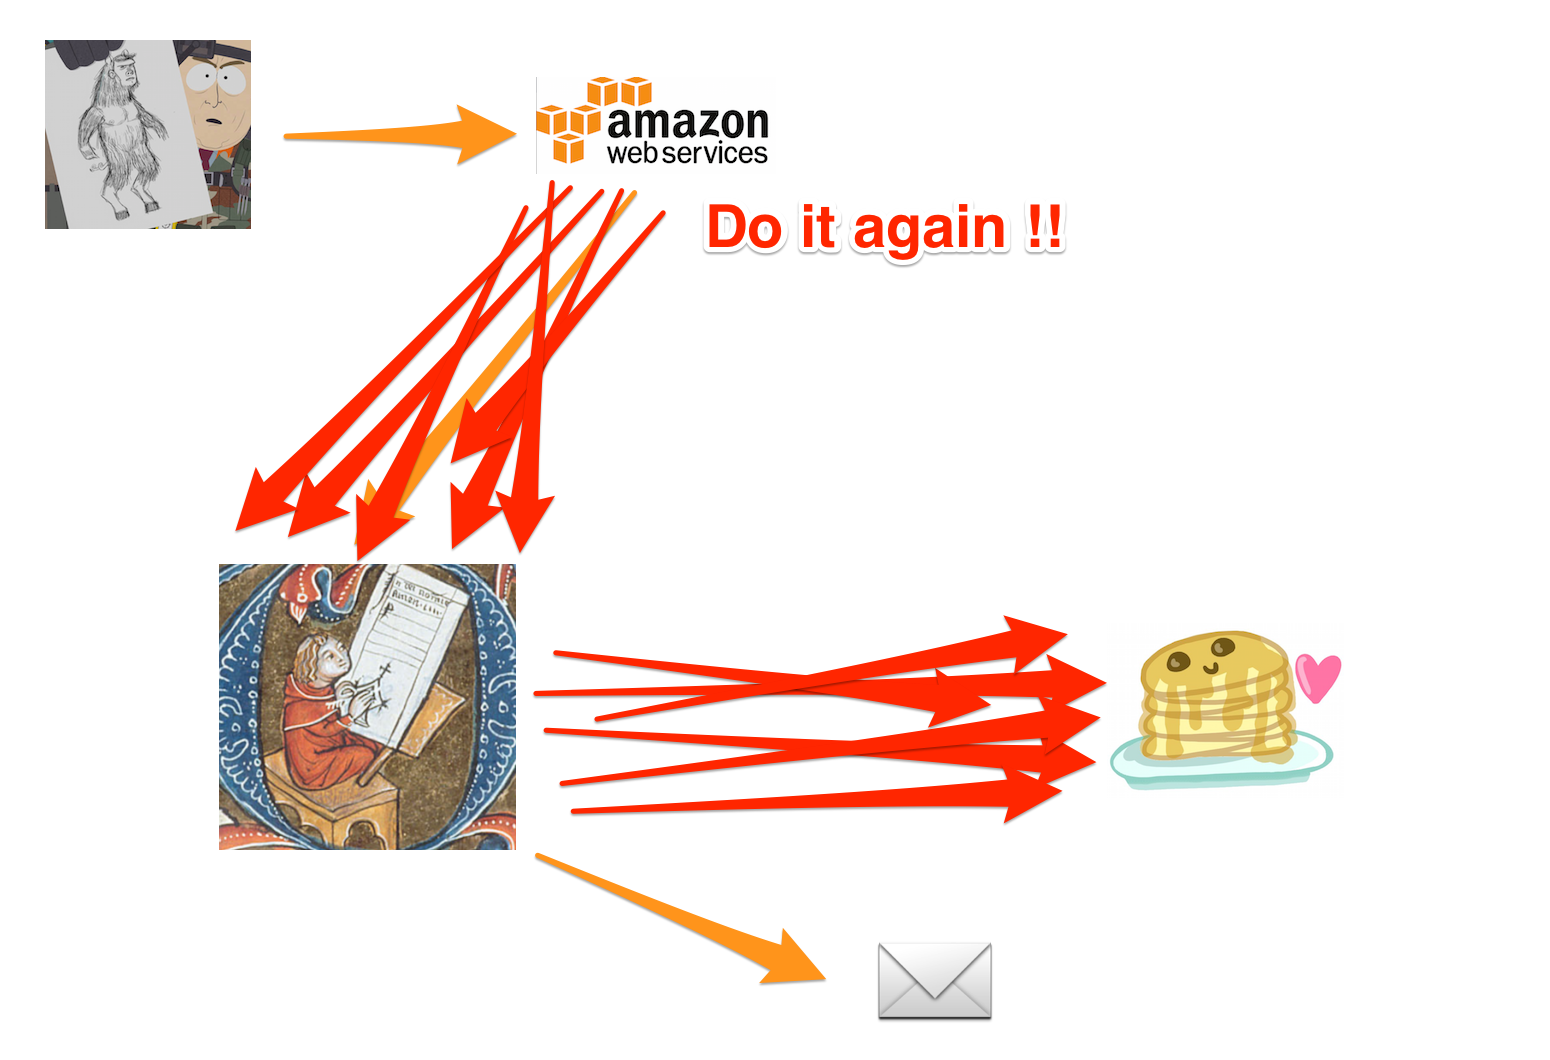
The first project our Team converted to SQS was a document generation pipeline.
It was fed by a Lambda that kicked off a cron task to poll User-defined schedules and publish one message for each Unit of Work.
The daemon received & validated these messages, queried ElasticSearch through Data Services, composed an HTML email, and sent the result off to the User.

Meet the Players in Our Little Drama
This is Event Driven Architecture 101 caliber stuff right here.
What Could Possibly Go Wrong?
The Thundering Herd problem is described as
… a large number of processes waiting for an event are awoken when that event occurs, but only one process is able to proceed at a time. After the processes wake up, they all demand the resource …
Mmmm … in those terms, perhaps what happened with our new pipeline wasn’t a bonafide Thundering Herd. But it’s such a compelling name, so I’m asking you to cut me a little slack here. I could have written a Post entitled “Cascading Failure”, the riveting tale of a waterfall on the losing end of a beaver dam. Instead, I went with the more thrilling “stampede” analogy.
Naming aside, what we experienced was a Poster Child of a system DDOSing itself from the inside. And, much like a stampede, it left in its wake a trail of mayhem, confusion and tears.
Because at 2am PST the morning after we launched, this starts to happen:

Data Service Lag
It’s important to note here that the company had indexed a lot of ES documents. I mean, a lot. It’s our core business. And we were doing ‘live’ deep querying … Large data ranges; they take a while to resolve … Lots of nested criteria; yeah, they take a while too. And as much as we’d sharded & indexed the dataset, ElasticSearch couldn’t help but be a centralized, blocking resource.
It turns out that our ES clusters were not having a good day. And what didn’t make their day any easier was a batch of emails scheduled for New York City early-birds firing off at 5am EST, followed by a second wave at 7:30am.
30 Seconds!
With musical accompanyment brought to you by Andy C & Ant Miles.
I’m not sure when the first alarm bells went off, but I first got my first PagerDuty Alert at 6am. Hey hey, turns out I’m the Dev guy on call that week! By this point, our platform had been slowly crumpling for about 1 1/2 hours.
Not long after I’ve cracked my laptop and tried to get a handle on the situation, I’ve got the CTO on the phone demanding to know what’s gone wrong, and more importantly, how to stop it.
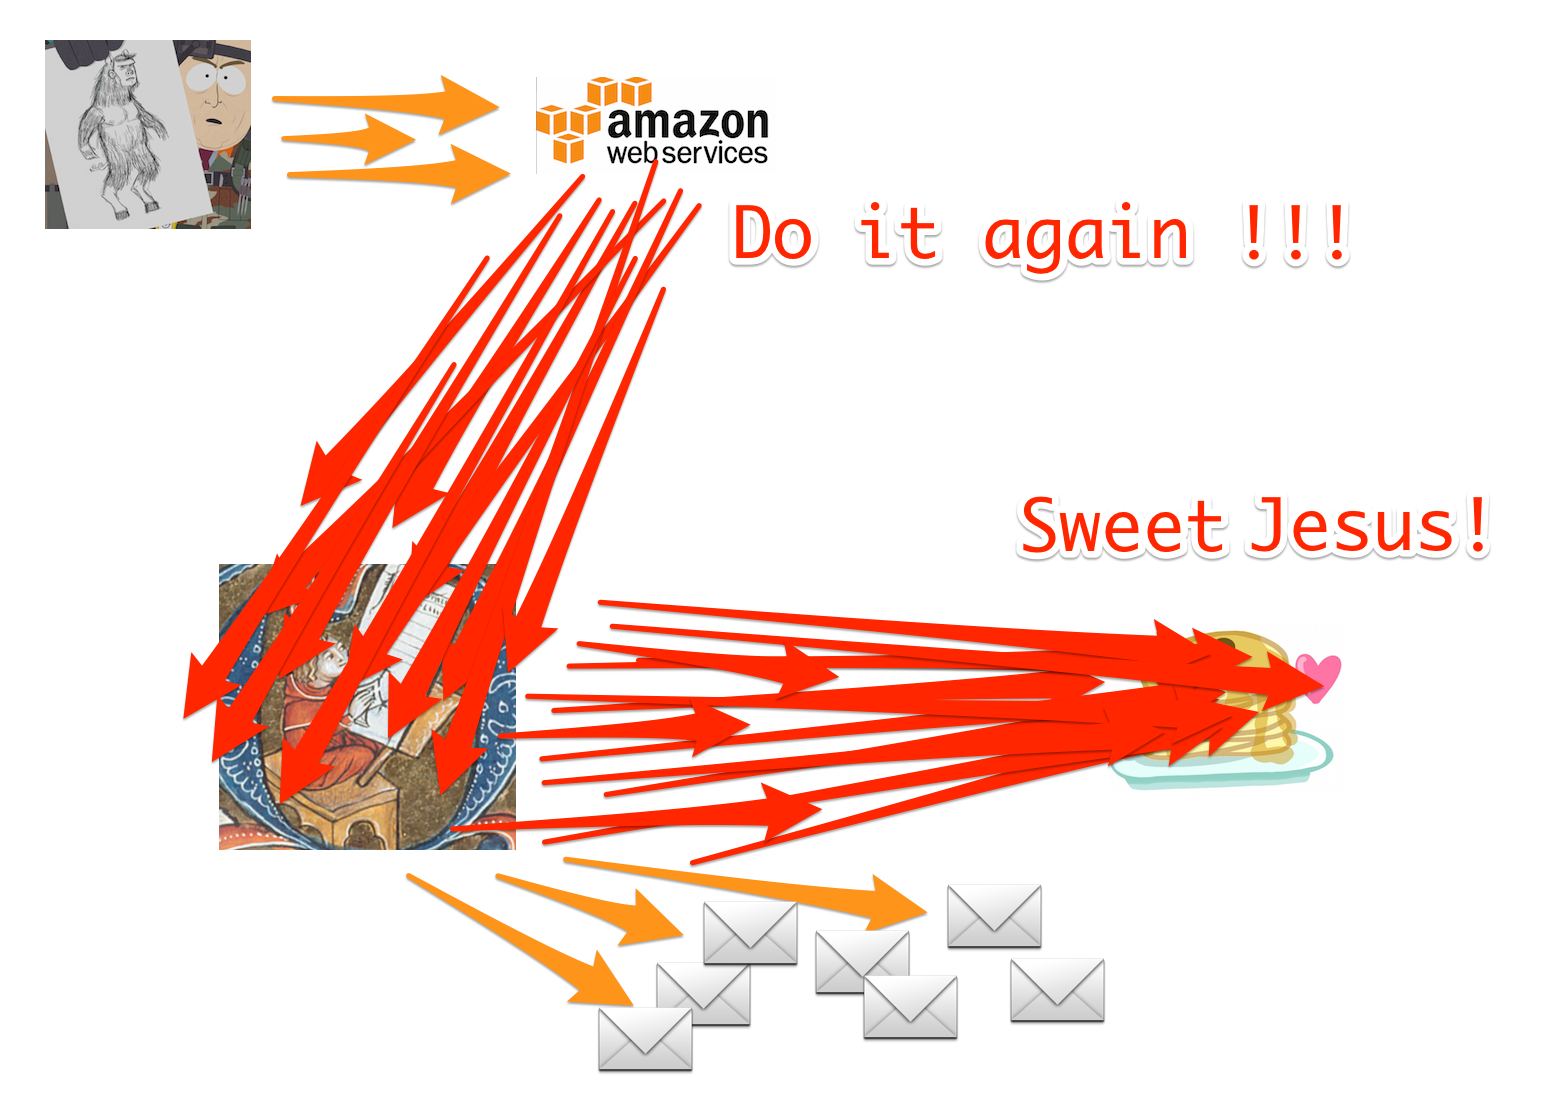
I wasn’t awake enough to recognize it immediately … but the SQS daemons on the Worker instances are doing their HTTP POST, waiting for 30 seconds, then timing out on the Unit of Work.
And what does a content pipeline do if, at first, it can’t succeed?
That’s right,

Perform a Retry after Failure
Message processing was dirt simple when we used AMQP; we opened a Channel, subscribed with a concurrency limit, and never timed out on a message. Occasionally the Data Service would produce a failure, perhaps due to a request timeout somewhere along the network. Upon failure we would NACK and, in the absence of a DLX, retry immediately. In practice, retries happened so rarely that the downstream impact was negligible.
But that was then. Now they’re happening every 30 seconds, our Production Services are getting slammed by batch-priority requests, and, of course, that’s impacting the public site.
Which, naturally, leads to more of …

Data Service Overload
At this point, you may be asking yourself,
“How could one content pipeline be causing so much disruption?”
What a timely question!
Now, while we did have the forethought to fetch the content serially – to, you know, minimize the impact, in the unlikely event that this problem would ever occur in the wild – there was one very important thing that we overlooked.
And though I’m speaking of “we” in these sentences, I really should be saying “I”.
Success Considered Harmful
It is now my pleasure to introduce another Minor (yet Vital) Player in our ensemble; the SMTP Proxy. He’s been there the whole time, just out of sight;

The Sound of Approaching Thunder
Despite all the load, eventually the Data Service will respond successfully. It just takes longer than 30 seconds per request. Our pipeline diligently chugs away, gathers all those hard-earned results, composes an email, and sends it to the Customer.
Yes, the SQS Daemon may have given up … but we sure as hell weren’t going to let some little upstream termination stop us from completing that Unit of Work! Successfully!! Again. And again. And again.
Because, that SQS Daemon? It’s going to try again after 1 minute. At which point it will spawn another pipeline that will chug away, gathering data, competing for Production Services with all of its dilligent siblings. And our Users.
Oh, did I mention that my employer was actively wooing a new customer for a rather sizeable contract?

The Savanna, Trampled by Hooves
See, that’s why it’s 6am, and I’m in my jammies with the CTO on the phone demanding to know how to stop it.
Which I ultimately failed to do. My direct Manager was also in on this 6am call. He’s the guy who shut down the Worker instances while I froze, bedazzled by the glamour of tracking down the “how”.
And … it is here that we close the curtain on our little Tragedy.
Putting On The Ops Hat
Sure, let’s start there.
Pro Tip: when you’re On Call, remember to turn off the ‘Do Not Disturb’ filter on your phone. That’s why I first heard about the incident at 6am.
Also, when shit is actively hitting the fan, that is not the time to analyze the problem. At best, launch your feature with a rollback plan that lets you pull the plug quickly. In the absence of a plan, have the instinct to make figuring-out-that-plan your highest priority.
I did not wear the Ops Hat well at all.
An Autopsy
Not possible. And ultimately, it doesn’t matter.
The Worker instances were burnt to the ground, and their local logfiles with them. We weren’t pushing ‘info’ log enries info Loggly, so most of the traceable details were lost.
Even so, we had several PagerDuty Alerts go off about too much Loggly traffic during the incident – mostly from Data Service components that the Content Pipeline had pushed to their limits.
Once the fire had gone out, I was able to suss out some analytics from the SendGrid API at the receiving end of our SMTP gateway. This only allowed us to understand the scale of the incident, how many Customers got how many emails, and who should be first in line for apologies.
Craptastic Configuration
I must admit, we didn’t give the Worker’s SQS Daemon very good instructions.
In fact, through the ‘Inactivity timeout’ & ‘Visibility timeout’ settings, we had given it a 30 second timeout ![]() .
.
“Oh, well there’s your problem,” I hear you think.
Yeah. Well, turns out it wasn’t.
Just you wait. It gets good …
Our ‘Error visibility timeout’ was something small-ish, on the order of 60 seconds.
Knowing now that the pipelines would end up overlapping themselves, that seems like such a silly value ![]() .
Something more along the lines of 5 minutes would have avoided building up such pressure.
.
Something more along the lines of 5 minutes would have avoided building up such pressure.
I’m pretty sure the concurrency limit we imposed with ‘HTTP connections’ was 25.
Again, in retrospect, ![]() .
But even at a lower threshold, the ‘HTTP connections’ setting is about active requests.
The fact that the Worker is still processing abandonned requests isn’t the Daemon’s problem.
.
But even at a lower threshold, the ‘HTTP connections’ setting is about active requests.
The fact that the Worker is still processing abandonned requests isn’t the Daemon’s problem.
And then there were the 10 retries in the ‘Redrive Policy’ for the DLX queue. All told, this was a recipe for a long and sustained disaster.
A Lack Of Mitigations
I’m relieved to announce that when I speak of “we” here, I’m not just talking about myself anymore.
We had adapted the SQS endpoint from the RabbitMQ pipeline. The code was highly segmented, so it was easy to omit some “superflous” features in the new routes.
Those were the features which imposed checks and balances.

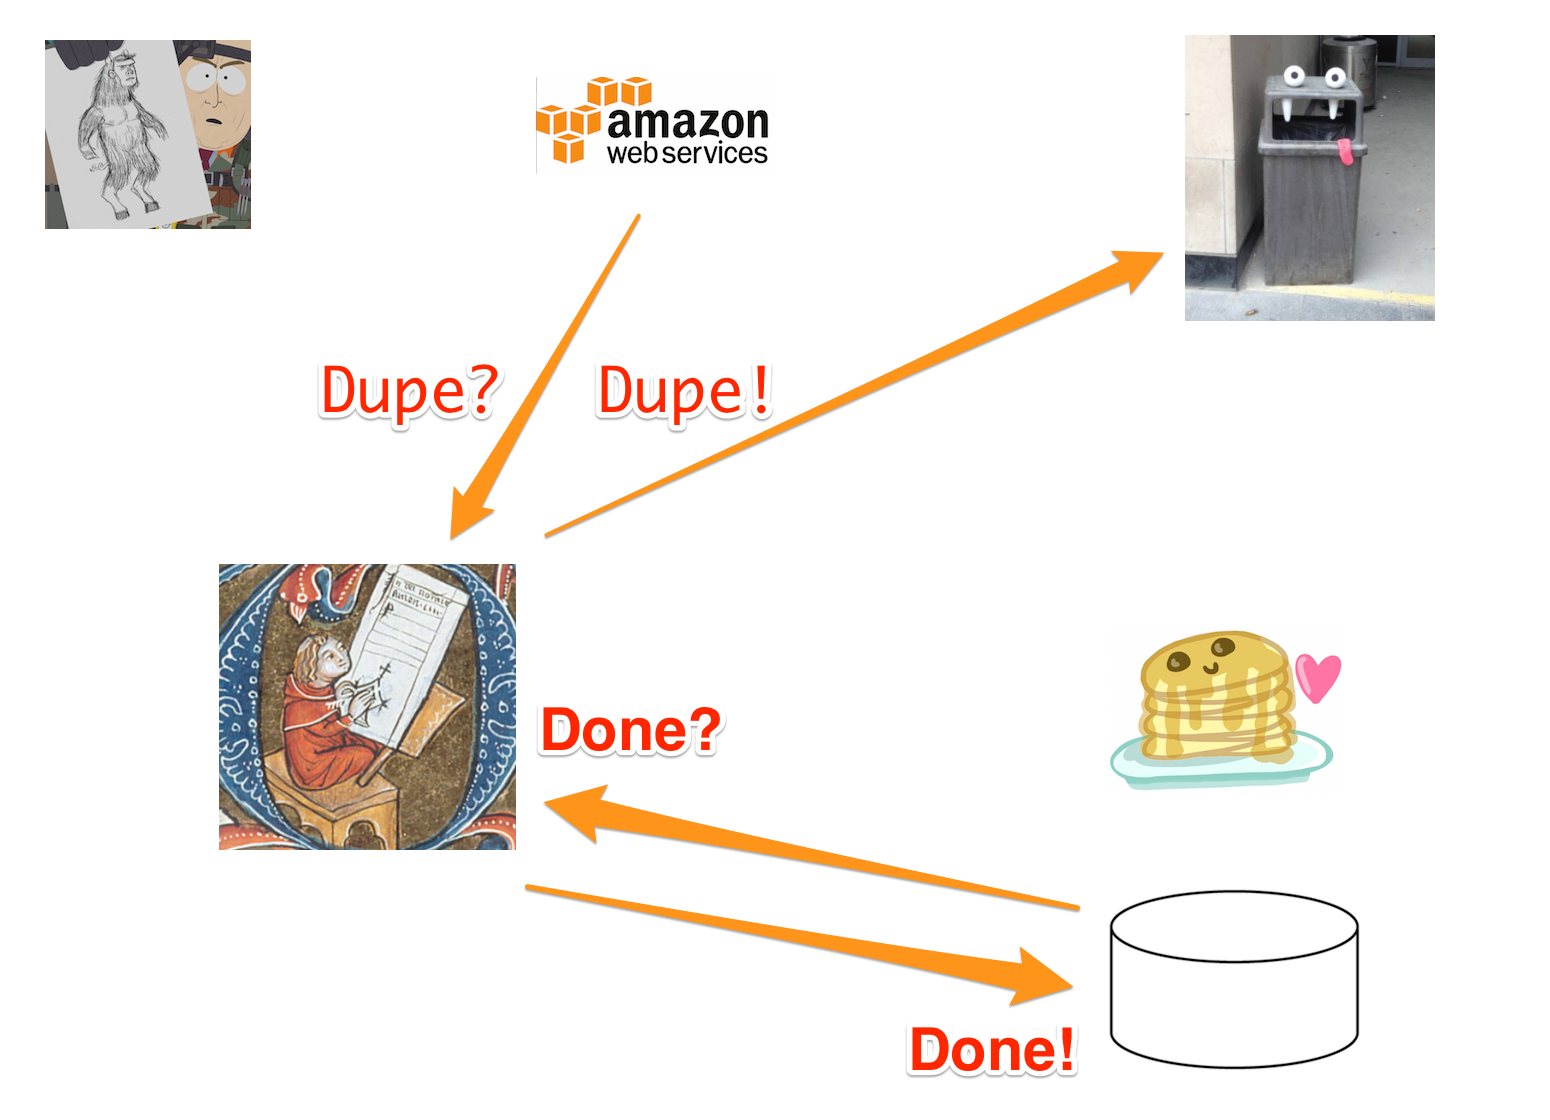
Mitigations: Deduping, Persisted Log
Right at the start of the pipeline, after parsing the JSON message, there was a dedupe check. Nothing special. The key storage was 100% in-memory, with no distribution. But we hadn’t spun up a lot of Worker instances, so a dedupe check would have been at least a small bulwark against the tide.
In addition, we kept an audit trail in MongoDB for each Unit of Work. There were a pair of cooperative segments in the AMQP pipeline;
- at the trailing edge, mark the Unit of Work as completed
- at the leading edge, don’t perform a Unit of Work that has already been completed
Again, not perfect. But once any given pipeline request had finally reached the finish line, no additional ones for that Unit of Work would have been allowed to start. It’s likely that this would have prevented pressure from building up in the first place.
However, the SQS endpoint never challenged the HTTP Daemon with any of these checks. It just said “okay” and got down to the tedious business of fetching content and composing that all-important email.
“Tedious business” … ?
Wait, You Said It Would “Get Good”
Oh, it does.
It turns out that what’s good for the Browser isn’t always good for the Daemon. The express App exposed by the Content Pipeline had been configured with a 30 second timeout.

Halt on Upstream Termination
And boy did that take a while to track down!
You see, the Server had been built to consume both RabbitMQ and HTTP traffic. And, being an expert on rendering content, one of the things the Server was asked to serve up was a live email preview. This, unlike its message-based responsibilities, was immediate and synchronous.
In all fairness, a User’s browser should be cut off after waiting an unreasonable period of time. But with an HTTP Daemon that implements its own failover logic, hold that Connection open forever and let the upstream make the decisions.
But we – ahem – I forgot about that setting. So … 30 seconds!
Whoops.
“Whoops” Is Right. Anything Else?
Yeah. When the upstream terminates, seriously … stop processing.
The pipeline was built as a Promise chain, and there were plenty of opportunities to Error out without sending communication to the Customer. Monitor the ‘abort’ on the Request and the ‘close’ on the Response, set a flag, and put circuit-breaker checks all over your pipeline, especially before sending out that email.
You may still waste a lot of cycles and bring your platform to its knees, but at least none of your Customers will get spammed in the process.